Financial Statements and Financial Data Summary
Download financial data for the past five years(Except for IFRS).
Contents
- Consolidated Financial Results
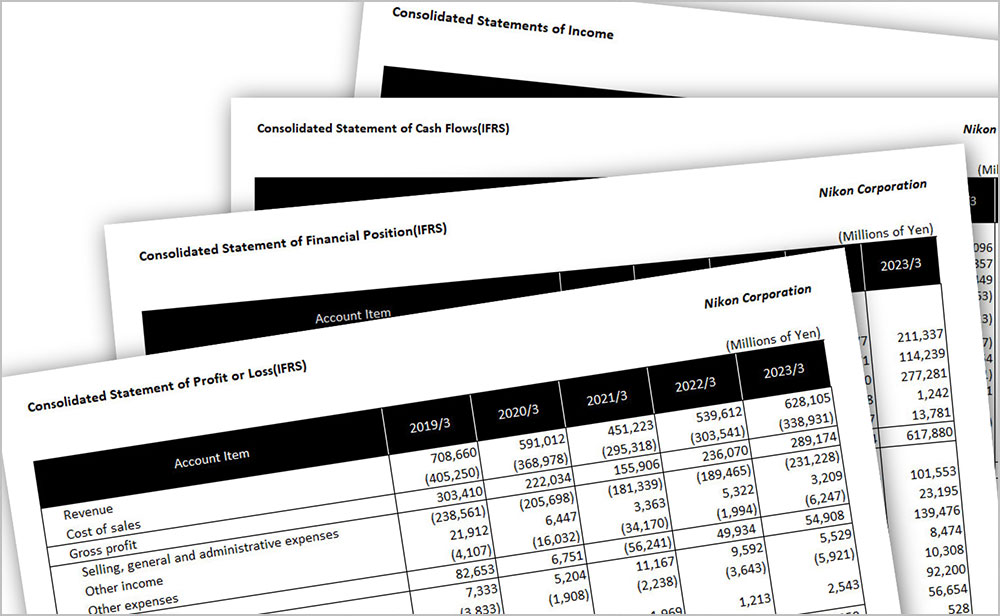
- Consolidated Statement of Profit or Loss(IFRS)
- Consolidated Statement of Financial Position (Assets)(IFRS)
- Consolidated Statement of Financial Position (Liabilities and Equity)(IFRS)
- Consolidated Statements of Cash Flows(IFRS)
- Consolidated Statements of Income
- Consolidated Balance Sheets (Assets)
- Consolidated Balance Sheets (Liabilities and Net Assets)
- Consolidated Statements of Cash Flows
- Segment Information (By Industry Segment, By Geographical Area)
- R&D Expenditures, Capital Expenditures, Depreciation and Amortization
- Major Selling, General and Administrative Expenses
- Number of Employees
- Number of Patents
- Financial Data Summary (Safety)
- Financial Data Summary (Profit Performance)
- Per Share Data, Share Price Index
- Non-Consolidated Financial Results